module
22
You have a list of numbers. This section turns it into something you can look at - which is most of what a home computer was bought for in 1984, once the games had been played.
It is also the first section that introduces nothing new. Everything in it you already have; what is new is fitting the pieces together so they do not fight.
to bar :height
fd :height
rt 90
fd 20
rt 90
fd :height
rt 180
end
Follow it round. Up by the height. Turn right, so you are facing across, and go twenty - that is the top of the bar. Turn right again and come back down the same height. Then turn 180.
Where does that leave the turtle? Twenty to the right of where it started, on the baseline, facing up - which is exactly how it started. That is the whole design. A shape that puts the turtle back into its starting stance can be repeated without anything in between.
Notice the bar has three sides, not four. The fourth is the baseline, and the next bar's left edge is this bar's right edge.
to chart :values
if emptyp :values [stop]
bar first :values
chart bf :values
end
This is the list walk from S15, with bar where the printing used to be. It can
be this short only because bar leaves the turtle ready.
The turtle begins in the middle of the screen, which would put half your chart off the left edge. So move it, pen up, before drawing anything:
to histogram :values
cs ht
pu
setpos [-110 -70]
pd
chart :values
end
setpos takes an [x y] pair and goes there. It does not turn the turtle -
it arrives facing whichever way it was already facing, which after cs is up.
That matters: if it turned to face its destination, every bar would come out
sideways.
ht hides the turtle so the finished chart has no arrow sitting in it.
to bar :height
fd :height
rt 90
fd 20
rt 90
fd :height
rt 180
end

to chart :values
if emptyp :values [stop]
bar first :values
chart bf :values
end

to histogram :values
cs ht
pu
setpos [-110 -70]
pd
chart :values
end

histogram [40 90 65 120 30 100]
Starting from
A fresh boot, at the ? prompt.
What you should see
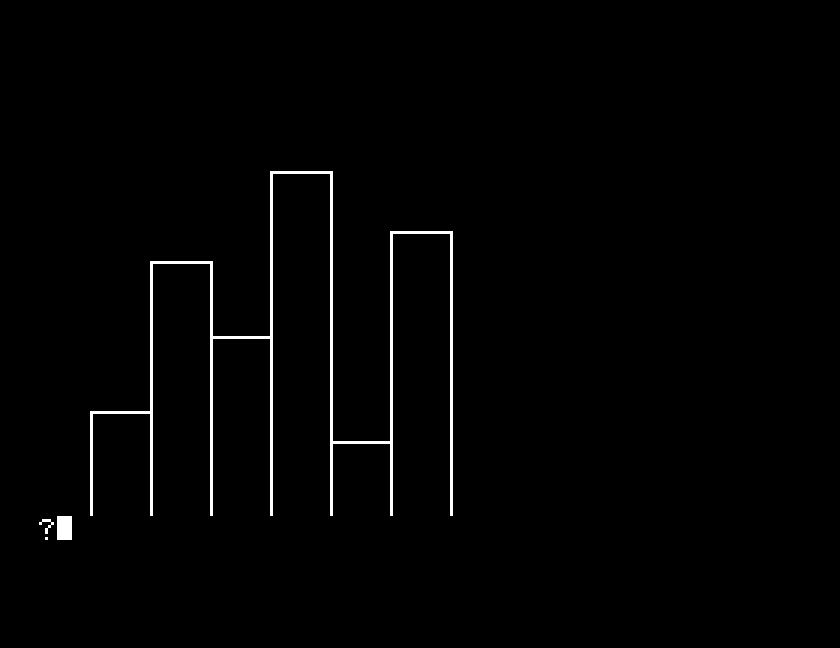
Six bars, in the order you gave them, twenty wide, each as tall as its number.
The drawing area and the text you type are the same forty columns by
twenty-four lines, so setcursor will put words on the picture:
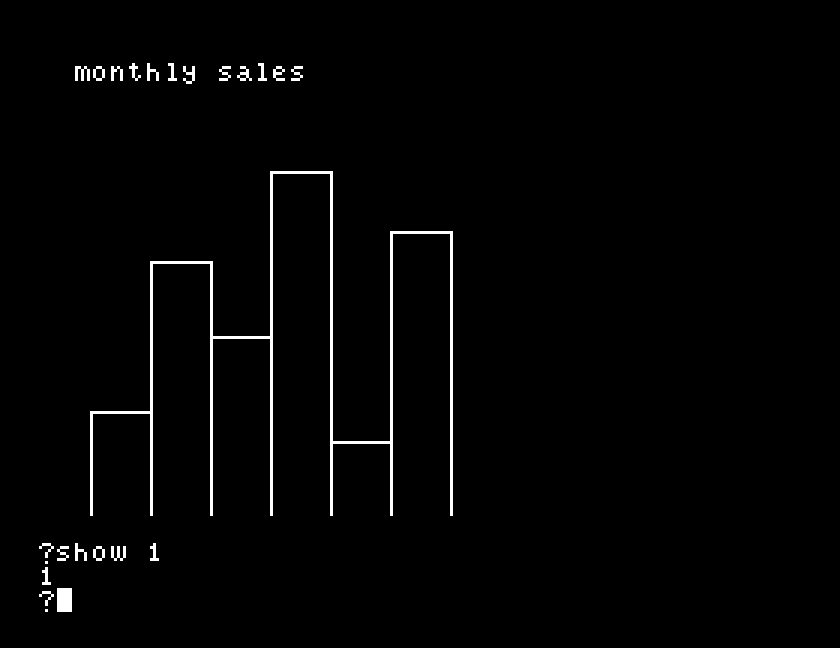
setcursor [2 1] type [monthly sales]
There is a catch, and it will bite you the first time. The prompt goes wherever you put the cursor, so the next thing you type starts at the top of the screen and walks down over your chart. Send it back afterwards:
setcursor [0 23]
Line 23 is the bottom, inside the four-line text window, which is where the
prompt lives normally. With those two lines added to the end of histogram:
0 in the list: histogram [40 0 65]. You get a gap. Work out from
bar why that is, rather than from the picture.histogram []. What clears, what draws, and which line decided?fd 20 in bar to fd 40, and give it three values. Then try nine
values without changing it back. Where does the chart go, and does Dr Logo
complain?setcursor [0 23] off the end and type anything. Now you know what
it was for.| Symptom | Cause |
|---|---|
| A staircase or a spiral instead of a row | bar is not returning the turtle to the baseline facing up. Count the turns - they must add to 360. |
| Half the chart is off the left of the screen | No setpos, so it started in the middle. |
| The bars come out sideways | A seth or a turn between setpos and the drawing. setpos on its own does not turn the turtle. |
| The chart gets typed over | setcursor left the prompt in the graphics area. Put setcursor [0 23] at the end. |
| A bar runs off the top | The value is bigger than the screen. Lines are clipped without an error - you will not be told. |
A shape that leaves the turtle where the next one needs it can be repeated
without any repositioning, and that turns "draw a chart" into a four-line list
walk. setpos moves without turning. setcursor puts text anywhere on the
screen including over a drawing - and takes the prompt with it, so send it back.
S23, curves from straight lines - repeat, and what a circle really is.
